MEEKER | A water year ends on Sept. 30, after runoff and after the monsoon, after fields have been harvested and headgates closed when the rivers have dropped to their baseline flow. Now is a good time to review the state of the river, while it takes a rest.
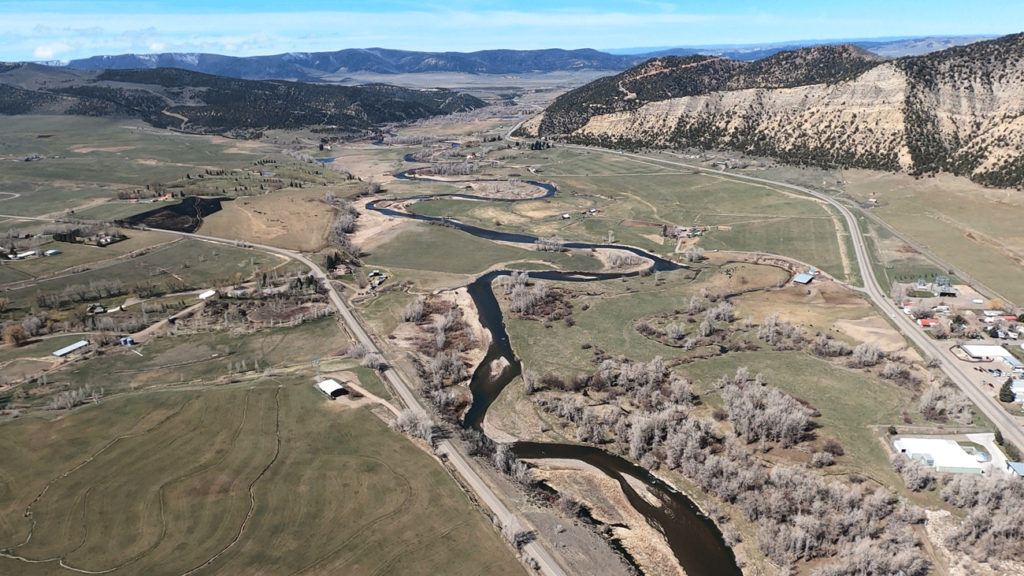
The river tried its best in 2022 but didn’t get much help. Total precipitation at the headwaters was low, again. Temperatures at the headwaters were much higher than normal, again. Consequently, total runoff came near historic lows, and daily flow hovered below the 25th percentile for most of the year. Again. Following are summary data documenting the historical records of climate and flows in the White River Basin.
You can find the full data sets at http://dorsett-edu.us/Climate/ClimateTrendsSummaryData_2022_PDF.pdf.
Climate data are obtained from the snotels at Trappers Lake, Burro Mountain and Ripple Creek, each with records spanning water years 1987 to present. Flow data comes from the USGS continuous real-time gauging station near Meeker (station 09304500) which has the longest continuous record along the White River (from 1910 through the present).
Here, in brief, are salient results.
Mean daily temperatures in the period 2012-2022 ran significantly warmer than 1987-1997 (Figures 1 and 2). These observations are consistent with larger climate studies. (Note: 11-year periods were chosen so as to include a full solar cycle, to try to avoid any confounding effects of changes in solar insolation.)
Precipitation on the Flat Tops is decreasing (Figure 3). There is less water available for runoff into the headwaters of the White River. These trends are becoming more pronounced in recent years.
Total yearly runoff in the White River is decreasing (Figure 4), down by about 50,000 acre feet on average over the period of record. That represents roughly a 10% loss in available water volume.
Peak flow is decreasing (Figure 5), now roughly 800 cfs lower on average than it was 30 years ago. Among other consequences, low peak flow scours algae off the stream bed less effectively, so algae remains on the substrate from one year to the next. Decreased flow also changes sediment transport and fish habitat along the river.
Peak runoff in the White River also occurs earlier in the year. Historically, peak runoff occurred in early June, but peak is trending earlier. April runoff is increasing and June runoff is trending downward (data not shown). Longer periods of low flow in the summer provide favorable conditions for algae growth, increase stress on fish, and also decrease available irrigation and municipal water supplies.
The data presented here document global and regional trends toward a hotter, drier world. Updated climate models predict that climate conditions in the White River Basin 30 or 40 years from now will resemble the present brush and sandstone regime of southeastern Utah (Talsma et al, 2022; NCA 2018).
On a positive note: we haven’t seen a big algae bloom for the past couple years. It’s not at all clear what happened to stifle the algae. Low water and higher water temperatures, such as we are seeing in the basin, generally encourage algae growth. A plausible assumption is that efforts by the Conservancy Districts and the White River Alliance are paying off. People have stepped up to try to reduce nutrients going into the river and to reduce insecticide application. A final report from the USGS algae study group is still pending, and some particulars, such as point sources of nutrients, are not available. However, we can take some hope that people are making a positive difference in the health of the river.
References:
Fourth National Climate Assessment. 2020. National Academies of the United States. https://nca2018.globalchange.gov/
Talsma, Carl, Katrina Bennett and Velimir Vessilimov. 2022. Characterizing drought behavior in the Colorado River Basin using unsupervised machine learning. Earth and Space Science.
https://agupubs.onlinelibrary.wiley.com/doi/10.1029/2021EA002086
By BOB DORSETT, MD
Special to the Herald Times